https://www.youtube.com/watch?v=aucqnf8rkaM
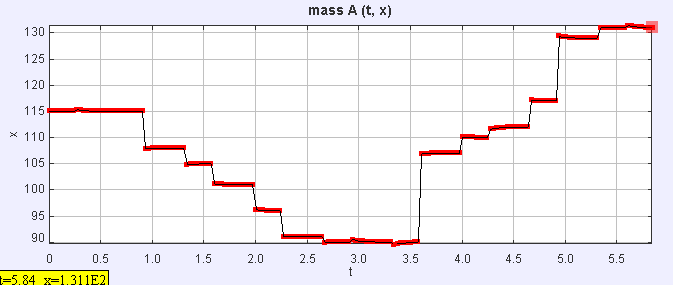
Figure 1.
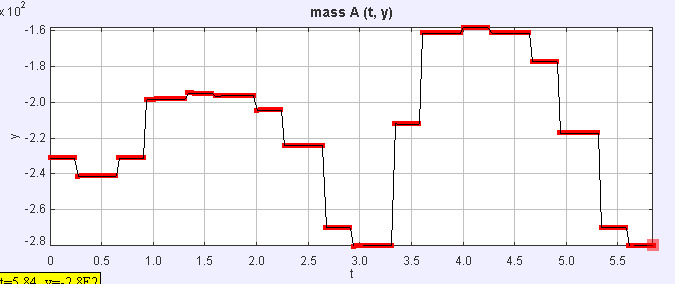
Figure 2.
|
Figure 1 is the Position vs Time for the x-axis. This is not horizontally straight as in the ideal situation because the subject was not able to jump up and land back down in the same position.
Figure 2 is the Position vs Time for the y-axis. As can be seen from the graph, it depicts the sinusoidal curve as expected. However, it does not look as symmetrical as the ideal situation because the subject did not take the same time to land and jump for each rotation. |
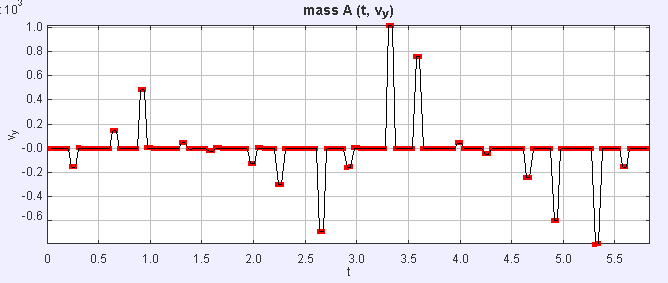
Figure 3.
|
Figure 3 is the Velocity vs Time for the y-axis. Keep in mind that this is a cartoon representation, thus, it does not follow the natural laws of physics. The velocity graph is not what we expected compared to our success with the position graph, mainly because the makers of the cartoon are looking for visual appeal and not following laws of physics.
|
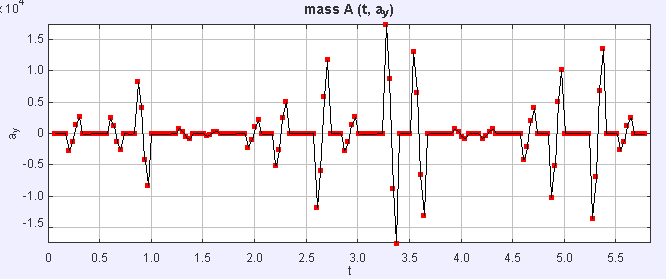
Figure 4.
|
Figure 4 is the Acceleration vs Time for the y-axis. The error from velocity graph is carried through to the acceleration graph.
|
